How to Use Inspectropulse: Watch Site Health Over Time
Inspectropulse gives you free live checks for any website. Routing & headers follows a domain’s redirect chain hop by hop and grades its security headers, Domain visibility checks whether crawlers can reach and index it, and Paste mode analyzes your own access-log lines entirely in the browser. Two more tabs, Pulse and Uptime, are private owner dashboards for Byteslip’s own logs and pings. This guide walks every tab with annotated screenshots from the live tool.
Inspectropulse vs Inspectrosite. They are siblings, not duplicates:
- Inspectrosite = page analysis. One homepage, 40+ HTML/SEO/a11y/perf/security checks with exact fixes.
- Inspectropulse = live route & visibility checks for any domain + private log paste. Redirects, headers, DNS/TLS/robots — not a page audit. (Its pulse and uptime dashboards are Byteslip owner-only.)

What You Need
- Any modern web browser. Nothing to install, no account.
- For Routing & headers or Domain visibility: the homepage of any public site (for example byteslip.org or https://example.com).
- Optional, for Paste: a few lines from an Apache/Nginx access log (cPanel Raw Access, access.log, ssl_log…).
- Nothing else. The Pulse and Uptime tabs are private Byteslip owner dashboards and stay locked for everyone else, so you won’t need them.
Walk Through Every Tab
-
01
Open Inspectropulse on Routing & headers
Open Inspectropulse. It lands on 🔀 Routing & headers, the first of three free public tools (🔎 Domain visibility and 📋 Paste an access log are the others). The 📈 Byteslip.org pulse and ⏱️ Uptime ping tabs are private owner dashboards, covered in steps 05–06. Deep links work too: #route, #visibility, #paste.
Type a domain or URL into the target box (defaults to byteslip.org) and press Check route. The check runs from the Byteslip server via /api/inspectropulse-check.php — not from your browser — so you see what that one vantage point sees.
Results include a clean-route verdict, the redirect chain hop by hop with timing/TTFB, and graded final response headers (HSTS, CSP, and friends). Use it to catch accidental http detours, redirect loops, or missing security headers on any public homepage.
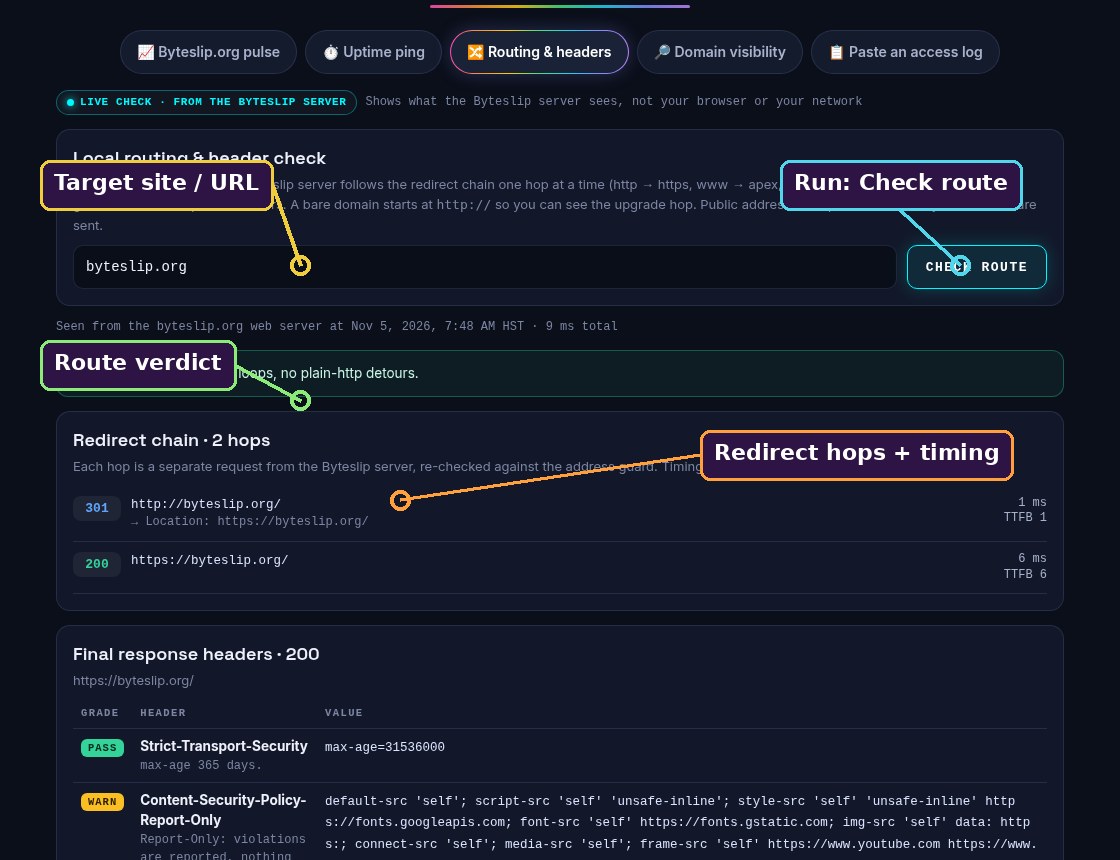
Step 01 — Routing & headers aimed at byteslip.org: target input, Check route, clean-route verdict, and the 301→200 hop chain with timing. -
02
Run Domain visibility
Tap 🔎 Domain visibility, enter a domain, press Check visibility. Inspectropulse grades whether crawlers can reach and index the site: DNS (A/AAAA/CNAME/NS for apex and www), TLS certificate validity, robots.txt allow/block, sitemap reachability, and noindex signals (meta robots / X-Robots-Tag). You get a clear Visible to crawlers: yes/no/… verdict.
It does not claim Google index status. Whether Google (or Bing) has actually indexed the pages needs Search Console / Webmaster Tools. The tool says so on the results card.
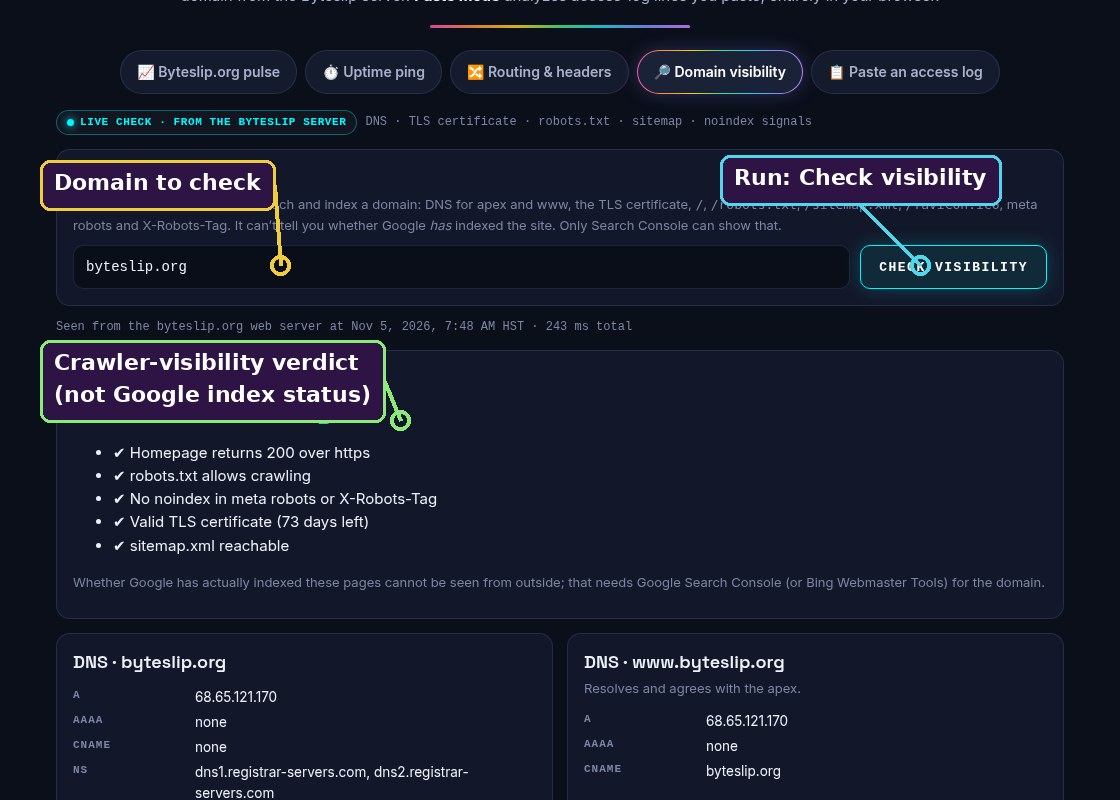
Step 02 — Domain visibility for byteslip.org: domain input, Check visibility, and the crawler-visibility verdict with DNS/TLS/robots/sitemap/noindex signals. -
03
Paste your own access log
Tap 📋 Paste an access log. Copy lines from your server’s access log and paste them into the box, then press Analyze (or Ctrl/⌘ + Enter). Parsing runs entirely in your browser — nothing is uploaded or stored. You get the same style of status cards, probe hits, bot share and spike flags that the owner-only Pulse shows for Byteslip, but for your lines. IPs are only ever shown truncated.
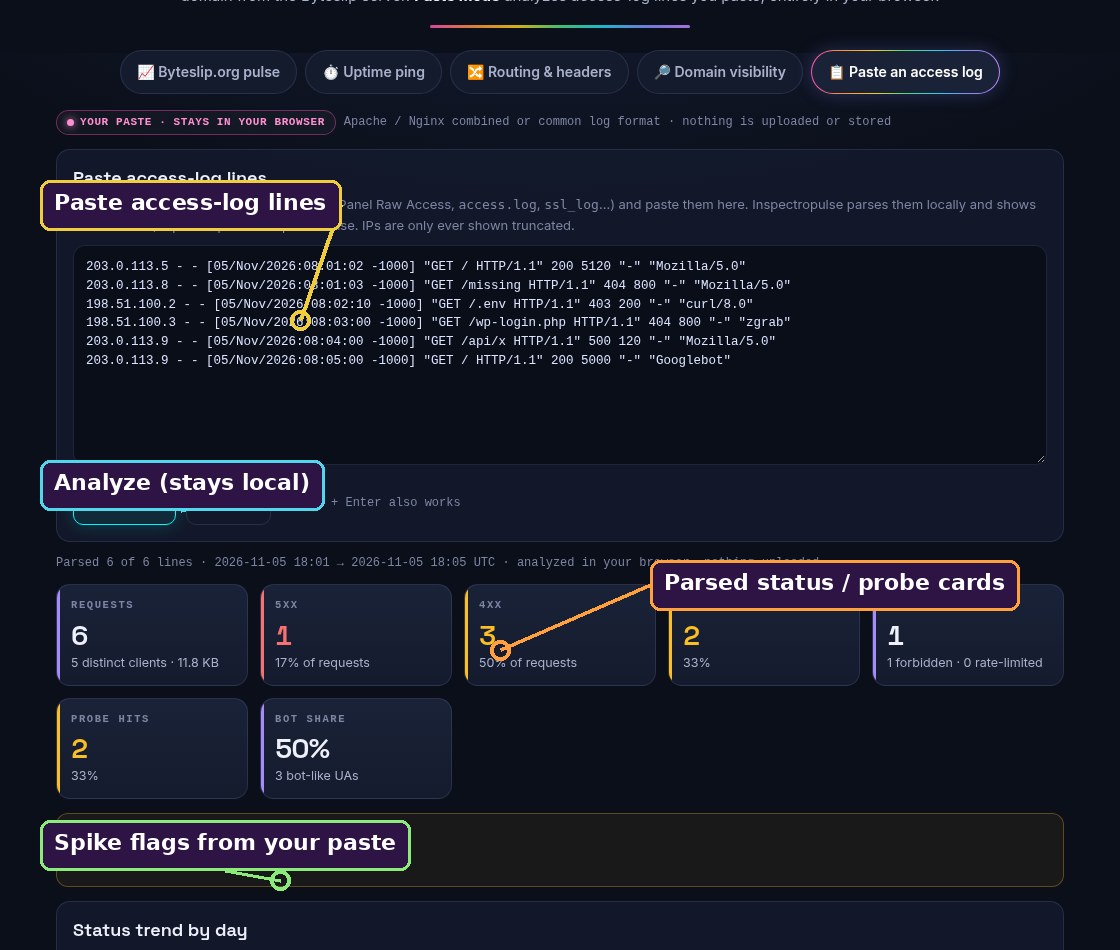
Step 03 — Paste mode with a small sample log: paste box, Analyze (stays local), parsed status/probe cards and spike flags — nothing leaves the browser. -
04
Aim it at any site’s homepage
For Routing and Visibility, any public homepage works. Enter the bare domain (example.com) or a full URL (https://example.com/). Live checks always run from the Byteslip server, so results reflect that one network vantage — useful for “what does the host’s neighborhood see?” and not a substitute for multi-region monitoring.
Pulse and Uptime are not for other sites: they are private dashboards built from Byteslip’s own logs and ping cron. For your own traffic over time, use Paste with your access-log lines.
-
05
Byteslip.org pulse Owner-only
📈 Byteslip.org pulse is a private dashboard for Johnny, who runs Byteslip. It turns Byteslip’s own access logs, CSP reports and bot log into 14-day status trends, 4xx/5xx spike flags and top error paths. Those are Byteslip’s traffic numbers, so they are not public.
Visitors see a lock panel that says Private: Byteslip owner stats, with a passphrase field, an Unlock button and links back to the public tools. The lock is enforced on the server: /api/inspectropulse.php returns no stats without the owner’s session. After unlocking, Johnny gets the full dashboard and a small 🔒 Lock button to sign out of it.

Step 05 — Pulse, as the public sees it: locked owner-only dashboard, passphrase + Unlock for Johnny, and links to the three public tools. -
06
Uptime ping Owner-only
A cron on the Byteslip server pings byteslip.org every 5 minutes. When Johnny unlocks ⏱️ Uptime ping, it shows the last check, 24h / 7d / 30d uptime %, response times, TLS days left and recent failures. Like Pulse, it is a private owner dashboard, so everyone else sees the same lock panel.
Want to check a site’s availability yourself? 🔀 Routing & headers shows whether any homepage answers right now, with timing for every hop.

Step 06 — Uptime ping, locked: owner-only tab, Private: Byteslip owner stats panel, and the public tools that stay open to everyone.
What It Can and Can’t See
- Owner-only: Show 14-day status trends, 4xx/5xx spikes, top error paths, CSP Report-Only noise and bot/probe hits for byteslip.org from real access logs.
- Owner-only: Report 5-minute uptime pings for byteslip.org (24h/7d/30d %, response sparkline, TLS days left).
- Can: Follow any public domain’s redirect chain and grade security headers from the Byteslip server.
- Can: Judge crawler visibility (DNS, TLS, robots.txt, sitemap, noindex) — without claiming Google has indexed anything.
- Can: Analyze pasted Apache/Nginx access-log lines locally in your browser.
- Can’t / lags: Host archives raw logs about once a day (~2:20 AM HST), so Pulse can lag up to a day on the newest hours. The summary rebuilds at most every 30 minutes.
- Can’t: See the internet from more than one vantage — ping/route/visibility are all from the Byteslip server.
- Can’t: Offer log-based Pulse for sites other than Byteslip (use Paste for your own logs).
- Can’t: Read Apache error_log, crawl a whole site, or report Google index status.
- Not a page audit: for HTML/SEO/a11y/perf fixes on one page, use Inspectrosite.
Tips
- Start with Routing & headers on your homepage: one run shows the redirect chain, timing and missing security headers.
- When you change redirects or security headers, re-run Routing & headers on the homepage and compare the hop chain.
- Before launching a new domain, run Domain visibility — a missing sitemap, blocked robots.txt or accidental noindex shows up immediately.
- Paste a slice of yesterday’s access log after a deploy to spot new 404/403/5xx paths without shipping logs off-box.
- Pair with Inspectrosite: Route/Visibility for how the site is served and found, Inspectrosite for the page itself.
Troubleshooting
Why are Pulse and Uptime locked?
They show Byteslip’s own traffic and uptime numbers, so they are private owner dashboards for Johnny. The server only returns those stats to a browser that unlocked with the owner passphrase. Routing & headers, Domain visibility and Paste are public and need no passphrase.
Why does Pulse look a few hours behind? (owner)
cPanel archives raw access logs about once a day (~2:20 AM HST). The newest hours may not be in the archive yet, so Pulse can lag up to a day. The JSON summary itself rebuilds at most every 30 minutes.
Can I get a Pulse for my own domain?
No. Pulse is a private dashboard of Byteslip’s own logs. For your traffic, use 📋 Paste an access log with lines from your own host. Routing and Domain visibility do work on any public domain.
Does “Visible to crawlers: yes” mean Google has indexed me?
No. It means crawlers can reach the site (DNS, TLS, robots, sitemap, no noindex). Actual Google/Bing index status needs Search Console / Webmaster Tools. Inspectropulse never claims otherwise.
Why did my route check look different from my browser?
Live checks run from the Byteslip server. CDN geo rules, bot shields or IP-based blocks can make that vantage differ from your laptop or another country.
Is paste mode private?
Yes. Parsing is 100% in your browser. Nothing is uploaded or stored. IPs are only shown truncated in the UI.
Uptime says 100% but I had a blip — what gives? (owner)
The ping catches Apache/PHP/TLS/DNS failures on the host every 5 minutes. It cannot see network problems between visitors and the host, and a blip shorter than the interval can be missed. Coverage notes on the cards tell you how much history exists.